参考:https://www.zhihu.com/question/290475507/answer/3072853389

\documentclass{standalone}
\usepackage[svgnames]{xcolor}
\usepackage{amsmath}
\usepackage{tikz}
\usetikzlibrary{arrows.meta, positioning}
\tikzset{x=0.65cm,y=0.65cm, >={Latex[length=3mm, width=1.2mm]}}

\begin{document}
\begin{tikzpicture}[semithick]
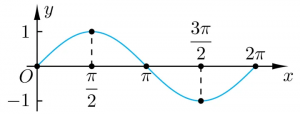
\draw[->] (-0.3,0) -- (pi*2.3,0) node[below]{$x$};
\draw[->](0,-1.3) --(0,1.8) node[anchor=145]{$y$};
\draw (0,-1) node [left]{$-1$} --+(0.15,0);
\draw (0, 1) node [left]{$1$} -- +(0.15,0);
\draw[domain=0:2*pi, samples=100, cyan] (0,0) plot(\x,{sin(\x r)});
\foreach \x/\y/\z in {0/below left/,pi*0.5/below/\dfrac{\pi}{2},pi/below/\pi,1.5*pi/above/\dfrac{3\pi}{2},2*pi/above/2\pi} {\fill (\x,0) circle[radius=1.5pt] node[\y]{$\z$};}
\draw (0,0) node[below left, inner sep=1.5pt]{$O$};
\draw[dashed] (pi*0.5,0)--+(0,1) (1.5*pi,0)--+(0,-1);
\fill (pi*0.5,1) circle[radius=1.5pt] (pi*1.5,-1) circle[radius=1.5pt];
\end{tikzpicture}
\end{document}